
Updated September 2026
Someone on your block sold this summer, and the number surprised you.
That is usually how this starts. Not with a plan to move. With a number you heard on a Saturday, and a quiet question about whether your house is worth what theirs was.
Here is the honest shape of the answer in Alexandria. Your home has two official numbers attached to it, they measure different things, and neither one of them is a neighborhood number.
Start with the two numbers Alexandria actually publishes
The first is what buyers paid. Bright MLS counted 171 closed home sales in Alexandria City in July 2026, at a median sale price of $707,000, with 399 homes for sale citywide the following month (Bright MLS monthly market data, July 2026 closed sales and August 2026 active listings, Alexandria City, Virginia cut; LizLuke Team market pack, figures.json).
The second is what the city says. The City of Alexandria Office of Real Estate Assessments put the average value of existing residential property, single-family and condominium together, at $729,925 as of January 1, 2025, up 4.45% from an average of $698,794 in CY 2024 (City of Alexandria Office of Real Estate Assessments, Real Property Assessment Information, CY 2025 average assessed value). That page still carried the CY 2025 roll when we read it in September 2026, so treat it as the older of the two figures here.
Resist the urge to set those side by side and call the difference a gap. A median sale price is the middle of what actually sold in one month. An average assessed value is the mean of every existing home on the tax rolls on one January morning. Different statistic, different date, different basis. They are not comparable, and a lot of confusion at kitchen tables starts with someone comparing them anyway.
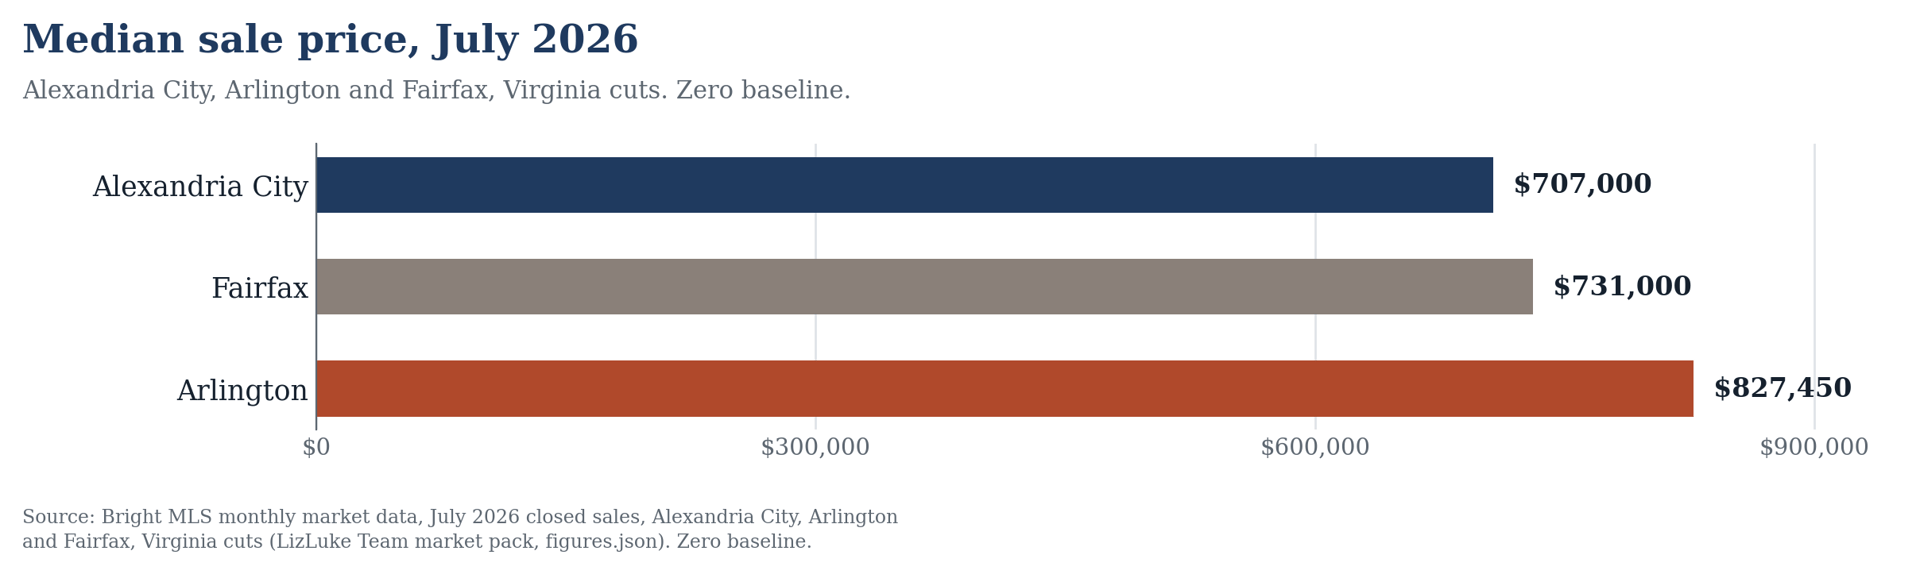
Chart 1. Median sale price, July 2026, Alexandria City, Arlington and Fairfax, Virginia cuts. Source: Bright MLS monthly market data, July 2026 closed sales (LizLuke Team market pack, figures.json). Zero baseline.
Property type moves the number more than the street does
If you want the single biggest divider in Alexandria values, it is not a neighborhood boundary. It is whether you own a house or a condominium.
The city's CY 2026 assessment figures put the average residential single-family home at $1,045,750, up 4.44% from $1,001,336 in CY 2025. The average residential condominium came in at $460,185, up 2.81% from $447,612 (City of Alexandria CY 2026 assessment figures as reported by ALXnow, February 27, 2026). Set those two CY 2026 averages against each other and the spread is $585,565, or about 2.27 times (our calculation from the two CY 2026 figures above).
Property type | Average assessed value, CY 2025 | Average assessed value, CY 2026 | Change, CY 2025 to CY 2026 |
|---|---|---|---|
Residential single-family home | $1,001,336 | $1,045,750 | 4.44% |
Residential condominium | $447,612 | $460,185 | 2.81% |
Read the change column, not only the level. Houses and condominiums did not move together on this roll, which is why two neighbors on the same street can open assessment notices in the same week and come away with completely different reactions. One owns a house. One owns a unit.
Citywide, locally assessed real property across all property classes rose 3.51%, to $50.7 billion in 2026, a figure that includes new construction as well as changes in value (City of Alexandria assessment figures as reported by ALXnow, February 27, 2026).
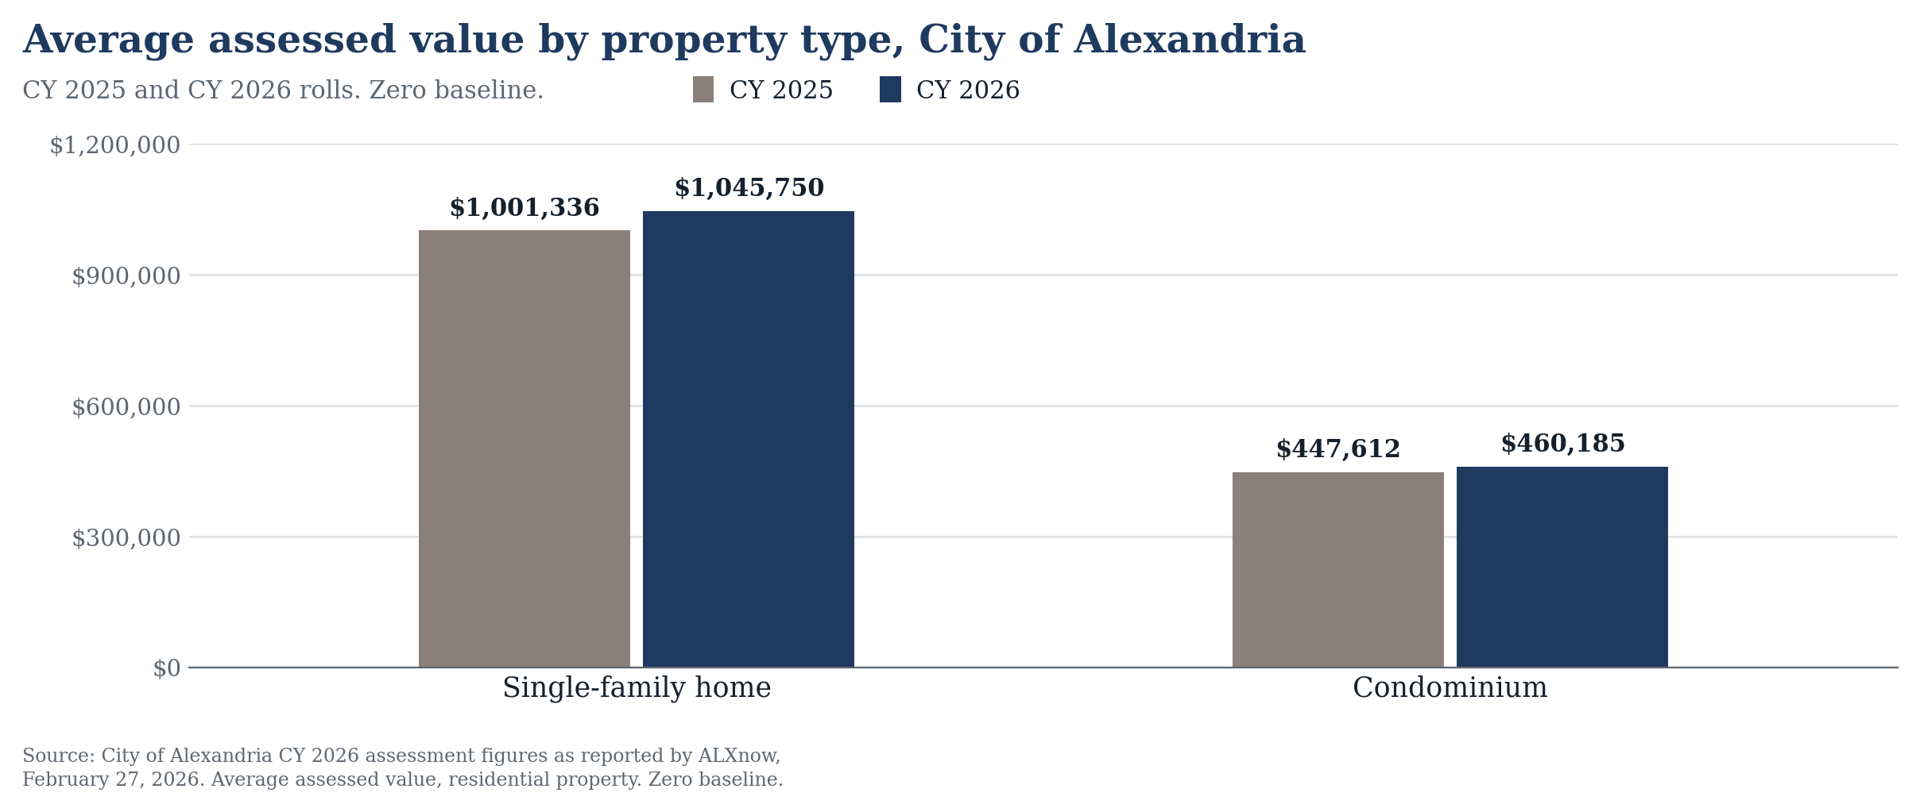
Chart 2. Average assessed value by property type, City of Alexandria, CY 2025 and CY 2026 rolls. Source: City of Alexandria assessment figures as reported by ALXnow, February 27, 2026. Zero baseline.
Neighborhood by neighborhood: what actually moves the number
Now the part you came for.
One honest note before it. Published median sale prices for Alexandria stop at the city line. There is no citable source that breaks out Old Town, Del Ray, Rosemont, North Ridge, Beverly Hills, Warwick Village, or Seminary Ridge as its own median, so you will not find a neighborhood price table in this post.
What we can tell you is what changes the number once you are standing on the block. The assessor works from the same idea. The city groups similar properties into study groups built on shared features, and location sits first in its own list, alongside year built, type, style, size, layout, and homeowner or condominium association. Neighborhood is already inside the city's valuation. It just is not published as a line item.
Old Town and the Parker-Gray blocks just north
Federal and Victorian rowhouses, converted commercial buildings, garden condominiums, and newer condominium construction all sit within a few blocks of each other here, which is exactly why a single Old Town number would tell you very little.
Two items come up on nearly every Old Town valuation conversation, and both are prep and disclosure work rather than judgments about the neighborhood. The first is design review: properties in the Old and Historic Alexandria District and in the Parker-Gray District go through architectural review for exterior changes, and that shapes what a buyer can plan and how long it takes. The second is water. Parts of the waterfront side fall inside special flood hazard areas, which affects insurance, lending timelines, and the questions a careful buyer's agent will ask.
Know which of those apply to your address before you price. Not after. We have walked through the design-review process and the flood-map check in more detail in the due diligence most Old Town buyers miss.
Del Ray and Warwick Village
Elizabeth has lived in Del Ray since 1993, so we will say this plainly: the value spread inside these blocks is about the house, not the zip code. If you are weighing Del Ray against Old Town for lifestyle fit rather than price, we compare the two directly in Old Town vs. Del Ray: which fits your lifestyle.
The bungalows and small-lot cottages have been added onto, dug out, and rebuilt at wildly different levels over the decades, and two houses on the same block can be a full renovation cycle apart in condition. Warwick Village brings a different stock again, brick attached homes on a planned street grid, where comparable sales are genuinely comparable in a way they are not elsewhere in the city.
At the north edge, the Four Mile Run corridor carries special flood hazard area mapping in places. Same rule as Old Town. Check the address, not the neighborhood.
Rosemont, North Ridge, Beverly Hills and Seminary Ridge
Larger lots, mature trees, and a mix of colonial revival, mid-century, and infill construction. Lot size and grade start to matter more here than they do closer to the river.
Marine clay soils show up in parts of the city's west side, and they are a real prep item on additions, foundations, and drainage. Aircraft on the National approach is audible on some streets and not on others. Commute geography matters too: proximity to the Mark Center, the Pentagon, and Fort Belvoir shapes who is shopping a given block in a given season. All of that is disclosure and preparation, not a ranking.
Why your assessment notice and your list price disagree
Because they are describing different years.
The city's assessment FAQ states it directly: each year's assessment is supported by sales that occurred during the prior year. The assessed value is the assessor's estimate of full fair market value as of January 1, built from what closed the year before.
So the notice that lands in your mailbox in the winter is a careful read of a market that has already moved. When the two numbers disagree, that is usually the reason, and it cuts both ways depending on which direction the year has gone.
Two practical things follow. If you think the assessment is wrong on the facts, the city's appeal filing deadline falls in mid-March, which means the current cycle has closed and you are working toward the next one. And if you are pricing a listing, the assessment is a data point, not a floor and not a ceiling. It is not an appraisal either.
How Alexandria sits next to its neighbors
Arlington's July 2026 median sale price was $827,450 across 226 closed sales. Fairfax's was $731,000 across 148 closed sales (Bright MLS monthly market data, July 2026 closed sales, Arlington and Fairfax, Virginia cuts; LizLuke Team market pack, figures.json). Alexandria City's median sat $120,450 below Arlington's, about 14.6%, and $24,000 below Fairfax's, about 3.3% (our calculation from those three July 2026 medians).
Inventory is thin in all three. Alexandria City had 399 homes for sale in August 2026, Arlington 420, Fairfax 264 (Bright MLS monthly market data, August 2026 active listings, Alexandria City, Arlington and Fairfax, Virginia cuts; LizLuke Team market pack, figures.json). Set those August listing counts against the July sales pace and you get roughly 2.3 months of supply in Alexandria City, 1.9 in Arlington, and 1.8 in Fairfax (our calculation; it divides August inventory by July closings, so read it as a rough ratio rather than a published statistic).
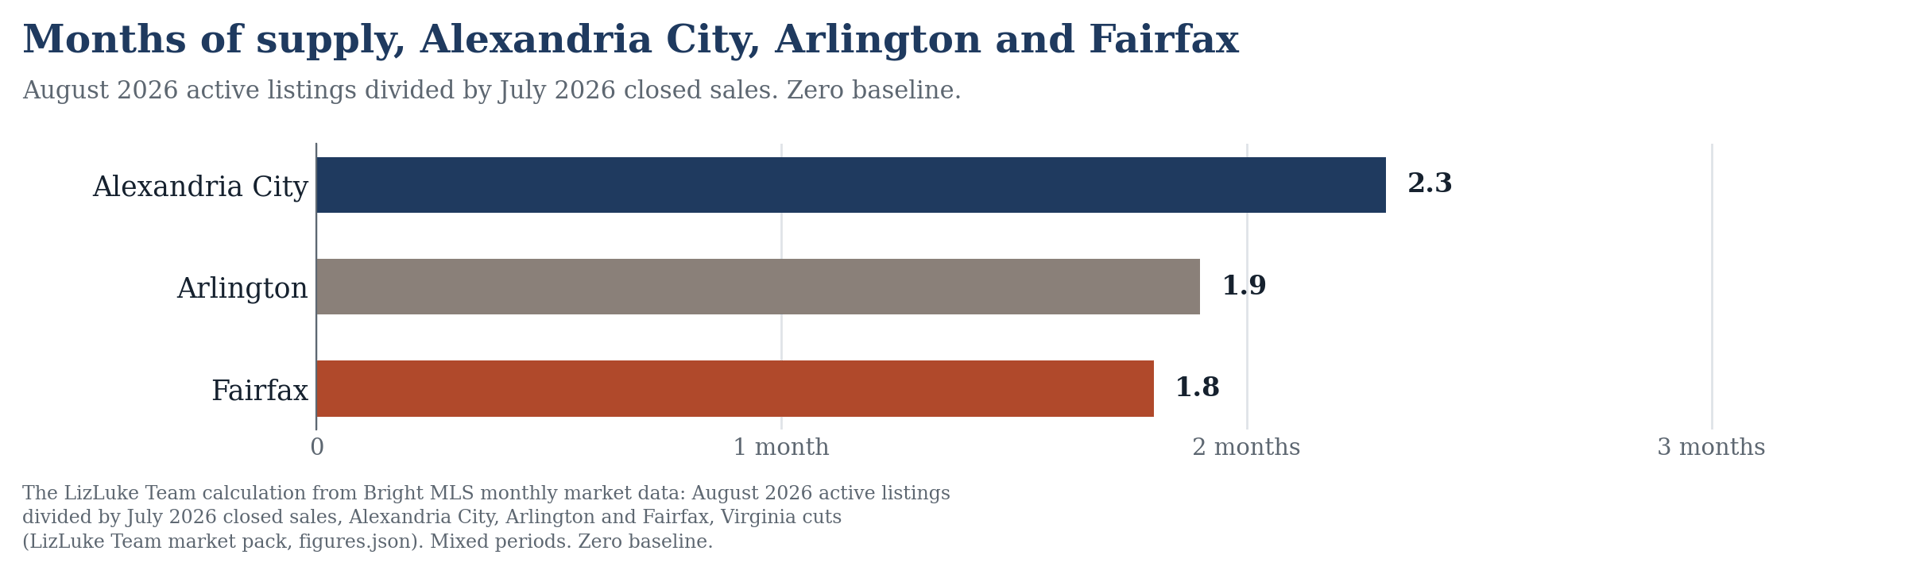
Chart 3. Months of supply, Alexandria City, Arlington and Fairfax, Virginia cuts. The LizLuke Team calculation from Bright MLS monthly market data: August 2026 active listings divided by July 2026 closed sales (LizLuke Team market pack, figures.json). Mixed periods. Zero baseline.
If you are cross-shopping the District, Bright MLS does publish neighborhood cuts there. For the same month, Georgetown's median sale price was $1,575,000 across 31 closed sales and Capitol Hill's was $990,000 across 35 closed sales (Bright MLS monthly market data, July 2026 closed sales, Georgetown and Capitol Hill, Washington, DC cuts; LizLuke Team market pack, figures.json). That is what neighborhood-level reporting looks like when the data exists. On the Virginia side it is published by jurisdiction.
Getting a number for your actual house
Three things get you closer than any citywide figure will.
Pull your own assessment record and check the facts on it. Square footage, bath count, finished basement, year of the last permitted work. A wrong fact on the record is the most fixable problem on this list.
Separate condition from location. In Del Ray, Rosemont, and most of the older stock, the renovation cycle a house is in explains more of the price than the street name does.
Then get someone to run the comparable sales at block level, with the flood mapping, the review district, and the soils pulled for your specific address. That is the number you can actually price against, and it is not something a citywide median can give you.
If you want to see how assessed value, online estimates, and a real comparative market analysis differ for your specific address before you call anyone, we break that down in what your Alexandria home is really worth.
We are Elizabeth Lucchesi and The LizLuke Team at LONG & FOSTER REAL ESTATE INC, and we work the whole market here, small condos through the high end. Most of our business comes from referrals and repeat clients, which means most of the valuation conversations we have start exactly the way this post did: someone heard a number and wanted to know what it meant for them. If that is where you are, we would be glad to put a number to it.
Sources
- Bright MLS monthly market data, July 2026 closed sales and median sale prices, August 2026 active listings. Alexandria City, Arlington and Fairfax, Virginia cuts, and Capitol Hill and Georgetown, Washington, DC cuts. LizLuke Team market pack, figures.json.
- City of Alexandria Office of Real Estate Assessments, Real Property Assessment Information, CY 2025 average assessed value as of January 1, 2025: alexandriava.gov/real-estate/real-property-assessment-information
- City of Alexandria CY 2026 assessment figures as reported by ALXnow, February 27, 2026: alxnow.com/2026/02/27/alexandria-residents-fuel-3-4-rise-in-tax-base-new-assessments-show
Market figures in this post come from Bright MLS monthly market data, July 2026 closed sales and median sale prices and August 2026 active listings, Alexandria City, Arlington and Fairfax, Virginia cuts and Capitol Hill and Georgetown, Washington, DC cuts (LizLuke Team market pack, figures.json). Assessment figures come from the City of Alexandria Office of Real Estate Assessments, Real Property Assessment Information (CY 2025 average assessed value, as of January 1, 2025) and from the City of Alexandria's CY 2026 assessment figures as reported by ALXnow on February 27, 2026. Months of supply, the median sale price gaps versus Arlington and Fairfax, and the single-family to condominium spread are our calculations from those figures.
This is general information and is not legal or tax advice.
The LizLuke Team at LONG & FOSTER REAL ESTATE INC. 110 N Royal St, Ste 300, Alexandria, VA 22314. Office 703.683.0400. The LizLuke Team (703) 868-5676. Virginia License #0225069250.
Equal Housing Opportunity.
All information is deemed reliable but not guaranteed.